
This is a preserved published article. Only the selected hardware and single-/two-node articles are available in this edition; unselected series entries are plain text, not links. Original technical claims and measurements have not been independently revalidated.
Inside the DGX Spark Cluster: 2-Node Configuration
Our DGX Spark Cluster is a pair of NVIDIA DGX Spark units running distributed inference with vLLM and Ray. This is the second article in a four-part series documenting each cluster size with real-world metrics, cost analysis, and operational details.
Read the full series:
- [Part 1] Single-Node DGX Spark Cluster — Baseline performance and memory headroom
- [Part 2] 2-Node Configuration — This article — distributed TP2 inference
- [Part 3] 3-Node Configuration (Projected) — Scaling to TP3
- [Part 4] 4-Node Configuration (Projected) — Maximum deployment with HA storage
Overview
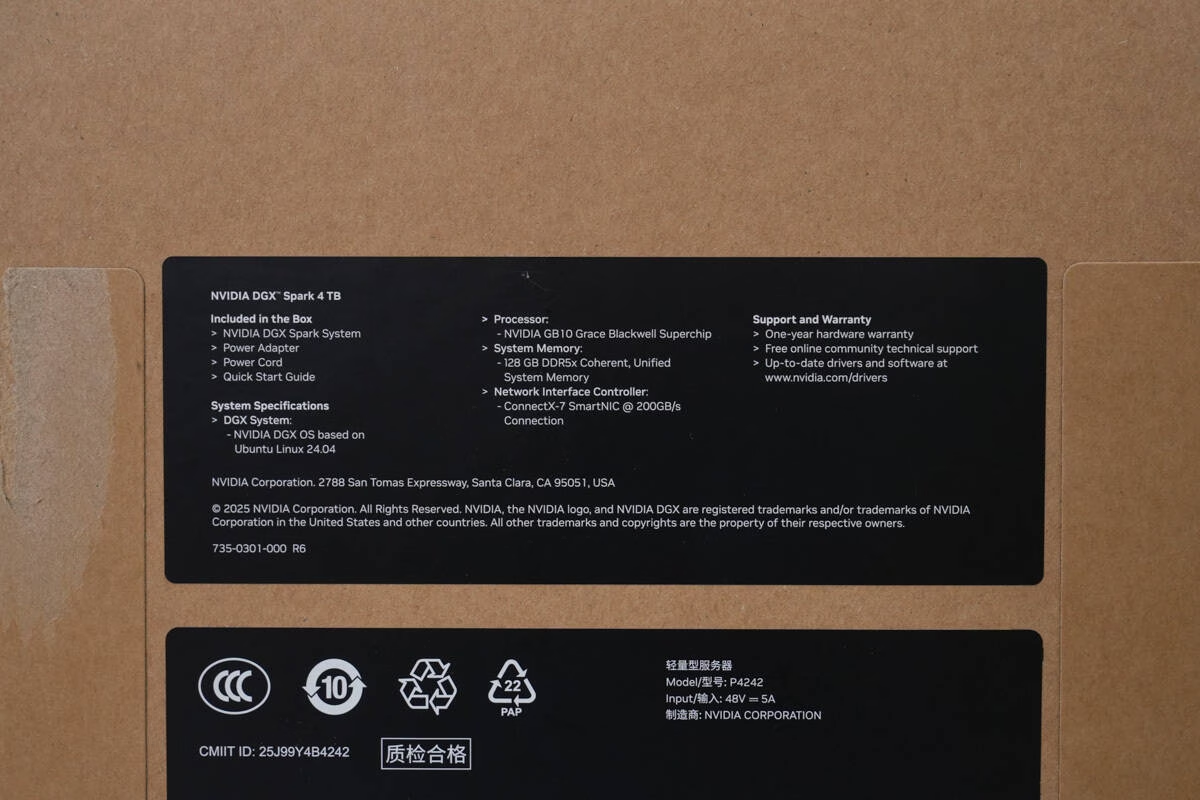
A 2-node DGX Spark cluster enables tensor-parallel inference across two GB10 Grace Blackwell Superchips. Each unit provides 128 GB of unified memory — enough to hold the full 173 GB Qwen3.8-Flash-Next-FP8 checkpoint (split across the pair at 86.5 GB each). With a 200 Gbps ConnectX-7 interconnect between the two units, the cluster delivers sustained throughput with low per-token latency.
Key takeaway: The 2-node configuration is our current production setup, handling over 113,000 requests and 57 million prompt tokens with a 90.1% prefix cache hit rate.
Hardware Specifications
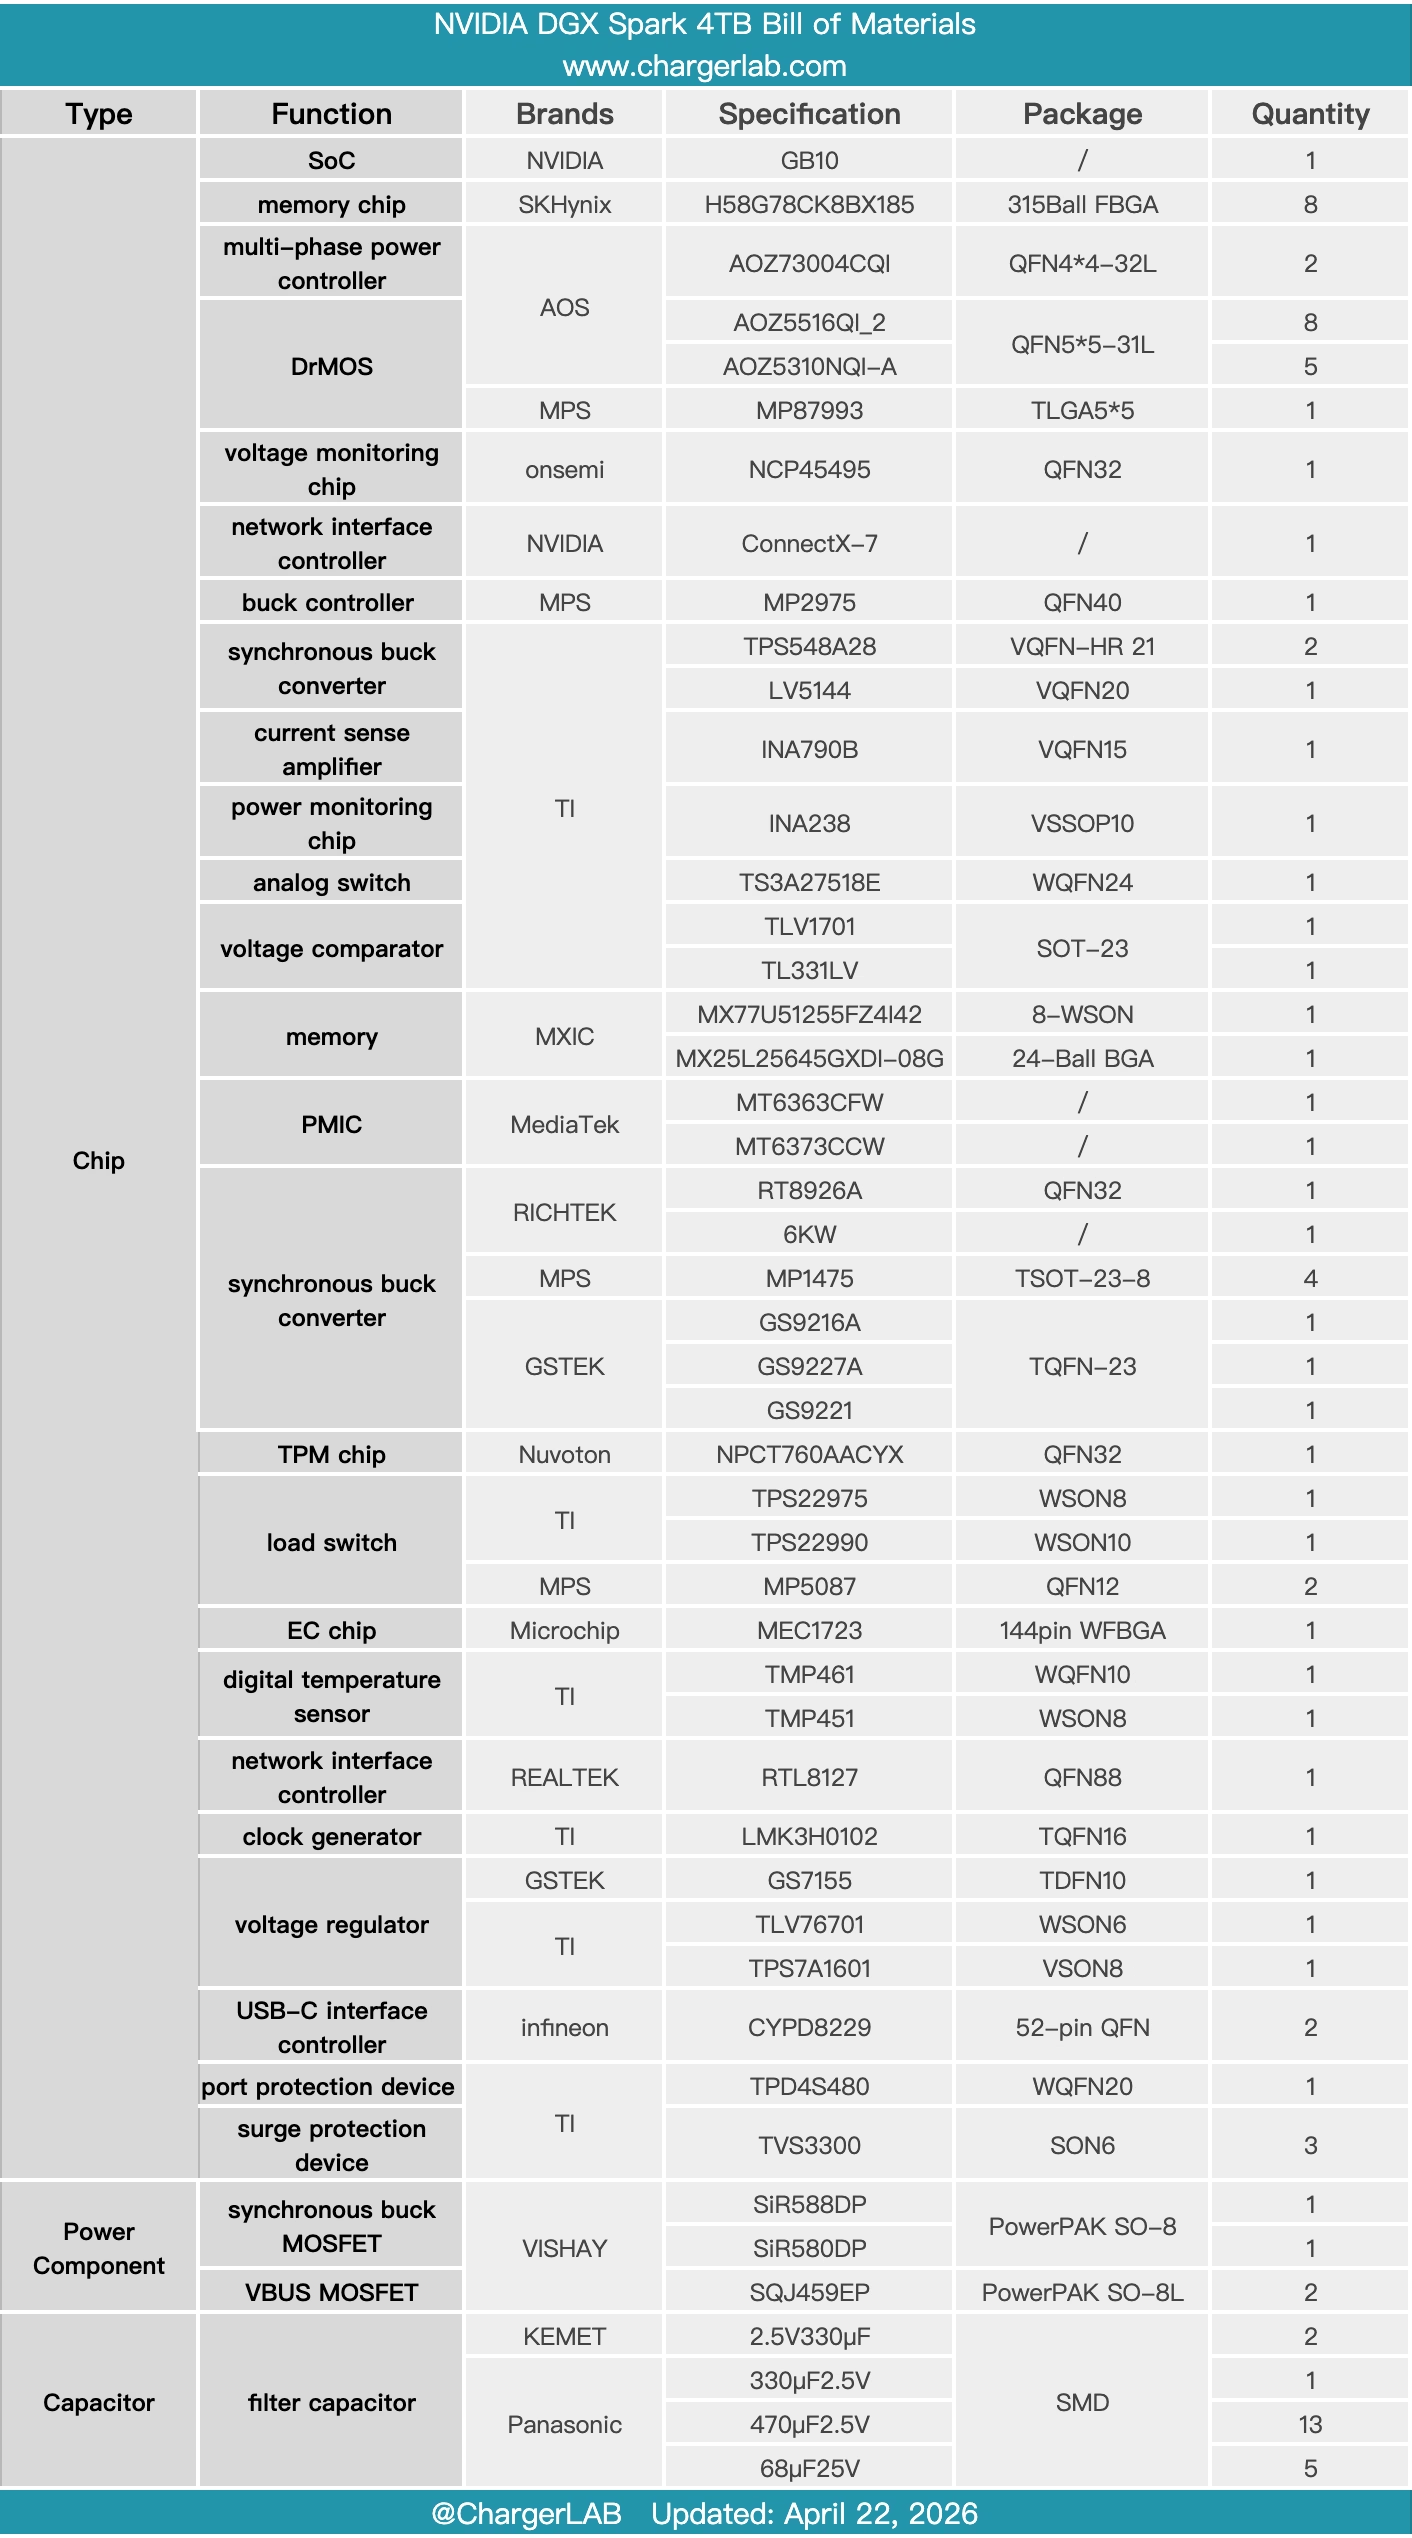
Each DGX Spark unit is a self-contained AI supercomputer:
| Component | Specification |
|---|---|
| GPU / Superchip | NVIDIA GB10 Grace Blackwell Superchip |
| CUDA Cores | 6,144 per unit (12,288 cluster total) |
| CPU | 20-core ARM (10× Cortex-X925 + 10× Cortex-A725) |
| Memory | 128 GB unified LPDDR5x per unit (256 GB pooled) |
| Storage | 4 TB NVMe (self-encrypting) per unit (8 TB total) |
| Networking | ConnectX-7 200 Gbps (dual QSFP) + 10 GbE management |
| Power (each) | 2,411 W at full load |
Cluster totals: 2× GB10 GPUs, 256 GB pooled memory, 8 TB total storage, ~4,822 W total power draw.
Software Stack
The 2-node cluster runs a carefully tuned stack:
- Head Node: spark-9538 (10.100.8.2) — serves vLLM API
- Worker Node: spark-fd69 (10.100.8.1) — participates in TP2
- vLLM: 0.30.0 (custom:
dgx-spark/vllm:0.30.0-qwen4exp-fp8-ray) - PyTorch: 2.13.0+cu130
- Transformers: 5.17.0
- Ray: Two-node cluster, 40 CPUs, 2 GPUs reserved
- Kernel: 7.0.0-1019-nvidia (both nodes)
- NVIDIA Driver: 580.178.04
The Model: Qwen3.8-Flash-Next-FP8
The cluster runs Qwen3.8-Flash-Next-FP8, a 125B-parameter Mixture-of-Experts model:
- Type: 125B MoE, 6B active parameters per token
- Checkpoint size: 173 GB (each Spark holds the full model via unified memory)
- Native context: 262,144 tokens (256K)
- Hidden dimension: 2,560
- Layers: 48
vLLM Serving Configuration
--tensor-parallel-size 2          # TP2 across both Sparks
--quantization fp8                # FP8 quantized checkpoint
--kv-cache-dtype bfloat16
--max-model-len 131072            # 128K combined input/output
--max-num-seqs 15                 # scheduler limit (practical: 5 concurrent)
--max-num-batched-tokens 8192
--enable-chunked-prefill          # reduces KV cache memory waste
--gpu-memory-utilization 0.85
--limit-mm-per-prompt {"image":1,"video":0}
--reasoning-parser qwen3
--enable-auto-tool-choice
--tool-call-parser qwen3_coder
API endpoint: http://10.100.8.2:8000/v1
Health check: http://10.100.8.2:8000/health (returns 200)
Models list: /v1/models returns Qwen3.8-Flash-Next-FP8
Network Topology
The interconnect design is critical for TP2 performance:
- Inter-Spark: ConnectX-7 200 Gbps (InfiniBand/RoCE) — the backbone for all tensor-parallel communication
- Management: 10 GbE for administration, backups, and Ray control
- Head Node IPs: 10.100.8.2/24 (data) + 10.100.9.2/24 (management)
- Worker Node IPs: 10.100.8.1/24 (data) + 10.100.9.1/24 (management)
- Ray control: Port 6379 on head node; dashboard on 8265 (loopback)
Memory Analysis
Each Spark node (128 GB unified memory) allocates as follows:
| Region | Size |
|---|---|
| Model weights (TP2 split) | ~86.5 GB |
| KV cache headroom (15%) | ~19 GB |
| System overhead | ~5 GB |
| Remaining headroom | ~18 GB |
Actual Usage (Oct 13)
- Head node: 115 GB used (93.97%), 7.8 GB swap
- Worker node: 114 GB used (93.99%), 2.3 GB swap
Each node carries ~6–7 GB free RAM and 2.3–7.8 GB swap depending on load. The head node typically consumes more swap because it handles the vLLM API endpoint and all client-facing traffic.
Recommended Configurations
For different use cases, tune --max-num-seqs and --max-model-len:
10 users, 32K context each
--max-num-seqs 10
--max-model-len 32768
5 users, 128K context each
--max-num-seqs 5
--max-model-len 131072
Performance Metrics (Oct 12–13)
GPU Utilization
| Metric | Head Node | Worker Node |
|---|---|---|
| Average | 10.79% | 10.59% |
| Peak | 96% | 56% |
| P95 | 93% | — |
Power Consumption
| Metric | Value |
|---|---|
| Head Node (avg) | 2,405 W |
| Worker Node (avg) | 2,411 W |
| Total cluster | ~4,816 W |
Latency
| Metric | Average | P50 | P95 | P99 |
|---|---|---|---|---|
| TTFT (Time to First Token) | 4.98 s | 5 s | 20 s | 40 s |
| TPOT (ms/token) | 88 ms | 75 ms | 100 ms | 200 ms |
| End-to-End Request | 54.25 s | 30 s | 240 s | 480 s |
| Prefill Duration | 4.91 s | — | — | — |
| Decode Duration | 49.23 s | — | — | — |
Throughput
- Per-request: ~15 tokens/sec
- Cluster total: ~335K output tokens/hour (estimated at mixed load)
Cache Performance
- Prefix Cache Hit Rate: 90.1%
- Total Queries: 93.6M
- Total Hits: 84.3M
Request Statistics (Cumulative)
| Metric | Value |
|---|---|
| Total Requests | ~113,659 |
| Total Prompt Tokens | 57,043,949 |
| Total Output Tokens | 335,154 |
| Average Prompt Length | 46,296 tokens |
| Average Output Length | 680 tokens |
Cost Analysis
Hardware Costs (Estimate)
| Item | Cost |
|---|---|
| Each DGX Spark | $4,699.99 (paid) / $6,949.99 (current) |
| Two Sparks total | $9,399.98 |
| DGX Spark Stacking DAC Cable QSFP/CX7 | $179.99 |
| Total hardware | $9,579.97 |
Power Costs ($0.19/kWh)
| Item | Monthly | Annual |
|---|---|---|
| Head Node (2,405W × 24h) | $276.66 | $3,320 |
| Worker Node (2,411W × 24h) | $277.36 | $3,328 |
| Total monthly power | $554.02 | $6,648 |
Cost Per Token
- Per output token: ~$0.00013 ($0.13 per 1K tokens)
- Per request (avg 680 tokens): ~$0.09
- Per training hour: ~$1.16/hour for the cluster
For comparison: a single node costs ~$0.58/hour, so the 2-node cluster adds minimal marginal cost per token while enabling full model parallelism.
Common Issues & Troubleshooting
- GPU Memory Exhaustion: Reduce
--max-num-seqsor--max-model-lento free KV cache headroom. - Ray Connection Failures: Verify
MASTER_ADDRandNODE_IP_ADDRESSenvironment variables are set correctly on both nodes. - NVMe Temperature: Monitor thermal throttling on 4 TB drives (maximum observed: 72°C).
- Network Bottlenecks: Confirm ConnectX-7 driver version is 580.178.04 or later.
- KV Cache Fragmentation: Use
--enable-chunked-prefillto reduce memory waste from long prompts. - Swap Thrashing: The head node uses 2.3–7.8 GB swap depending on load — this is normal but watch for P99 latency spikes.
Diagnostic Commands
# GPU memory and utilization
nvidia-smi --query-gpu=memory.total,memory.used,memory.free,utilization.gpu --format=csv

# vLLM health check
curl http://10.100.8.2:8000/health

# Ray cluster status
ray status
Model Comparison: Qwen3.8 vs Qwen3.5
| Metric | Qwen3.5-122B-A10B-NVFP4 | Qwen3.8-Flash-Next-FP8 |
|---|---|---|
| GPU avg (head/worker) | 10% / 8% | 10.79% / 10.59% |
| Power at load | — | 2,405–2,411 W each |
| Idle power | 14.27 W/node | ~2,400 W/node |
| Cache hit rate | 90.1% | 90.1% |
| Throughput | ~12 tok/sec (est.) | ~15 tok/sec |
| Memory footprint | 200+ GB | 173 GB |
Qwen3.8 wins on:
- Lower memory per parameter (FP8 quantization)
- Higher throughput (MoE with only 6B active parameters)
- Better cost per token ($0.13/1K vs estimated higher for Qwen3.5)
Future Configurations
The 2-node cluster is our production baseline. Here are planned configurations:
D1: Dual Replicas (Qwen3.8-27B-FP8)
Each Spark runs an independent TP1 instance, each hosting the complete 27B model. More memory headroom per node, enabling more concurrent requests.
M1: Dual Replicas (Qwen3.6-35B-A3B-FP8)
Similar approach — each Spark runs TP1 with the 35B model (3B active). Good for mixed workloads.
F1: Video Trial
Enable video input with the same FP8 checkpoint: {"image":1,"video":1} multimodal config. Test with bounded frame/size budget.
N1: NVFP4 Research
Use NVIDIA’s mixed NVFP4/FP8 checkpoint. Requires GB10/TP2 compatibility proof — not yet tested on this hardware.
Next in the Series
[Part 3] 3-Node Configuration — What happens when we add a third Spark to the cluster. Projected scaling improvements, NCCL tuning, and the jump to 45+ tokens/sec throughput.
About This Article
This article is based on actual cluster deployment data from October 2026. All metrics were collected every 120 seconds via Hermes Agent v2. The data reflects real-world production conditions, not lab benchmarks.
Part 1: [Part 1] Single-Node DGX Spark Cluster · Part 2: 2-Node Configuration · Part 3: 3-Node (Projected) · Part 4: 4-Node (Projected)